安装influxdb监控套件 ## 三件套:influxdb telegraf grafana ### infuluxdb 下载安装 ```console wget https://dl.influxdata.com/influxdb/releases/influxdb-1.2.2.x86_64.rpm yum localinstall influxdb-1.2.2.x86_64.rpm ``` 修改配置: ```console vim /etc/influxdb/influxdb.conf reporting-disabled = true #bind-address = ":8086" [admin] # Determines whether the admin service is enabled. enabled = true (web管理界面) bind-address = ":8083" (web服务界面的端口) ``` 开机启动 ``` systemctl start influxdb systemctl enable influxdb ``` 进入db ```console influx # 进入控制台,创建个db试试 create database test_db show databases; name: databases name ---- _internal test_db ``` 搞定。 注意: influxdb的数据文件 ```console /var/log/influxdb/influxd.log 日志文件 /var/lib/influxdb/data 数据文件 /var/cache/yum/influxdb 缓存处理数据 记得挂盘或者ln -s ``` ## telegraf ```console wget https://dl.influxdata.com/telegraf/releases/telegraf-1.3.0-1.x86_64.rpm yum localinstall telegraf-1.3.0-1.x86_64.rpm ## 编辑,配置 vi /etc/telegraf/telegraf.conf # 查找influx,修改influx的上报端口 [[outputs.influxdb]] ## The HTTP or UDP URL for your InfluxDB instance. Each item should be ## of the form: ## scheme "://" host [ ":" port] ## ## Multiple urls can be specified as part of the same cluster, ## this means that only ONE of the urls will be written to each interval. # urls = ["udp://localhost:8089"] # UDP endpoint example urls = ["http://localhost:8086"] # required ## The target database for metrics (telegraf will create it if not exists). database = "telegraf" # required # 打开注释,监控k8s [[inputs.kubernetes]] # ## URL for the kubelet url = "http://localhost:10255" systemctl start telegraf systemctl enable telegraf systemctl status telegraf ``` ## grafana ```console wget https://s3-us-west-2.amazonaws.com/grafana-releases/release/grafana-5.4.0-1.x86_64.rpm yum localinstall grafana-5.4.0-1.x86_64.rpm systemctl daemon-reload systemctl start grafana-server systemctl status grafana-server systemctl enable grafana-server.service ``` 编辑配置: ```console vim /etc/grafana/grafana.ini # 把3000端口改成你要的 ``` 打开web页,用默认账户登录,添加源 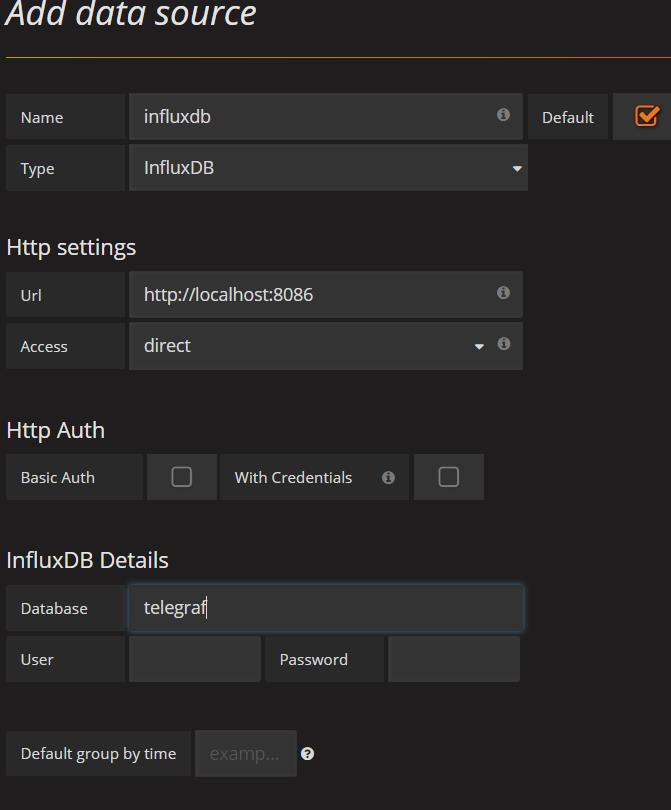 ## 配置telegraf监控 进入 https://grafana.com/dashboards/928 按它的配置,修改telegraf的配置。 下载json文件,进入new dashboard,然后导入这个json。 简直吊爆了。 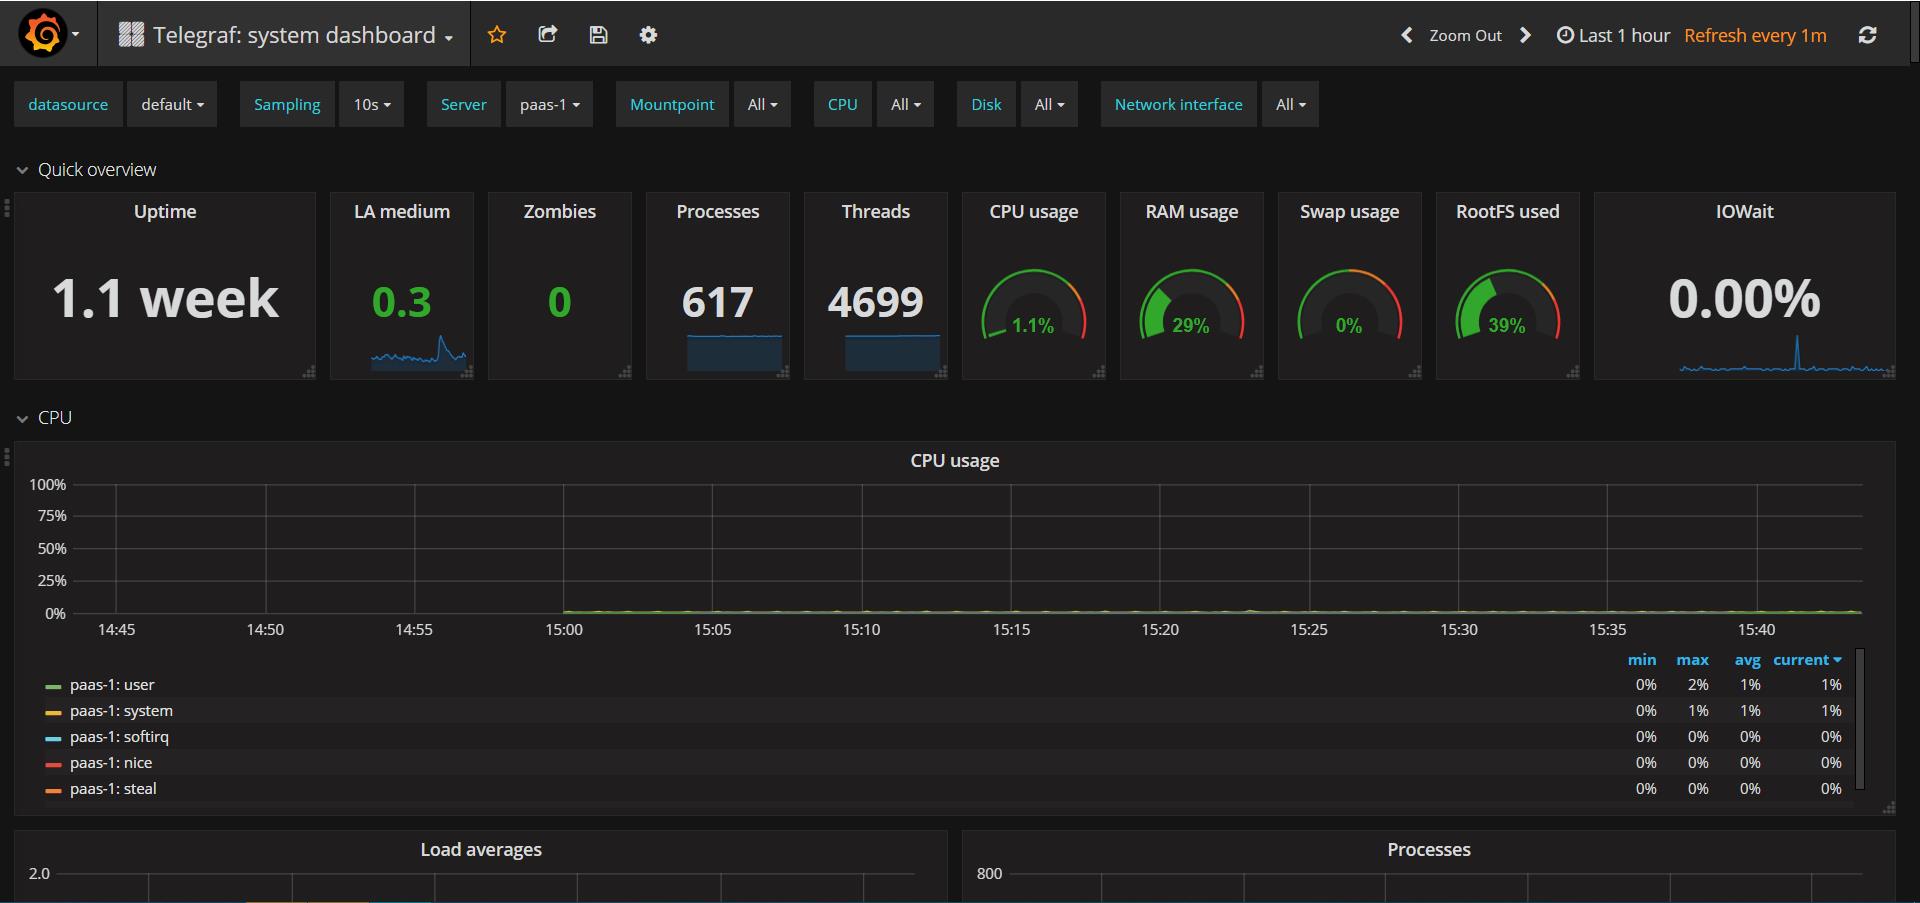 来自 大脸猫 写于 2019-03-22 14:20 -- 更新于2020-10-19 13:06 -- 0 条评论